Viewing Dashboards
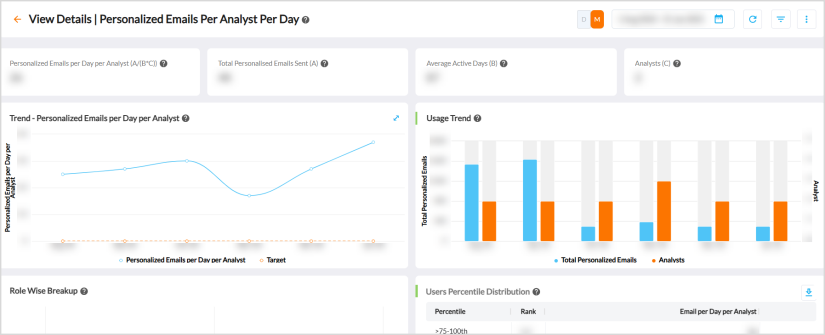
Dashboards provide a comprehensive snapshot of performance indicators using data visualizations. In Analytics, dashboards often focus on Key Performance Indicators (KPIs) and use multiple complex data sets to provide you with at-a-glance awareness of current performance. Dashboards also use data from the past to identify trends that can influence future decision making.
The dashboard data is presented in the form of widgets, aggregate tiles, and data grids.
The following table lists the actions available in a dashboard.
|
Icon or Button |
Usage |
| Back | Use this to navigate back to the previous page. |
| Help | Use this to view a help card within the dashboard context. The help card contains critical information such as Formula Used, Data included/excluded, and Definitions. |
| Daily (D) or monthly (M) toggle |
Use this to switch the entire dashboard view between daily or monthly, to obtain data and trends. Note: This feature is only applicable for Cash Application, Credit, Collections, Deductions, and EIPP Operational Key Performance Indicators (KPIs). This feature is not applicable for EIPP Adoption Rate % and % Active Customers via EIPP Portal KPIs. |
| Period selector | Use this to set the required time range for the dashboard, to obtain the data. |
| Refresh Dashboard | Use this to refresh the dashboard. |
| Filter |
Use this to filter the data in the dashboards using dashboard-specific criteria. For more information, refer to Managing Filters. |
Kebab menu  |
Use this to download, schedule, mark the dashboard as favorite, and so on. For more information, refer to Using Kebab Menu Options. |
Various Parts of a Dashboard
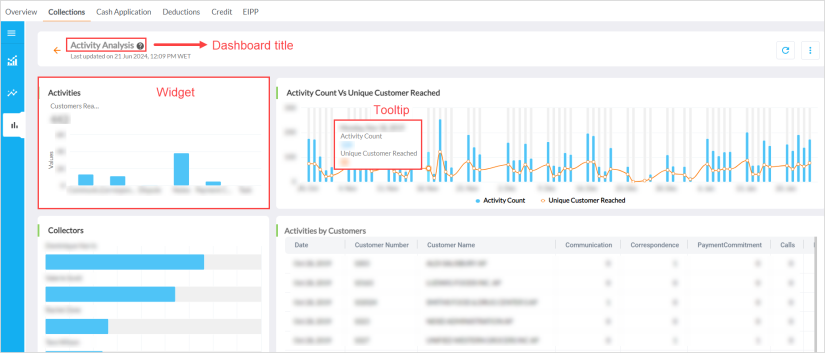
The following figure illustrates various parts of a dashboard.
-
Dashboard title - The text that appears at the top of the dashboard.
-
Tooltip - When you hover over a series or a point on a chart in the dashboard, you can view a tooltip displaying the values of the respective datapoint.
-
Last updated on - The Last updated on details are displayed under the dashboard name. The timestamp displays the date and the time when the data was last refreshed.

Note
This feature is only applicable for Standard Out-of-the-box dashboards.
-
Widget - Each dashboard is divided into a number of widgets. Each widget displays a chart or grid. Specific dashboards have search panels to filter data in the charts within the dashboards.
|
|
Note The fiscal versions of dashboards or reports are not displayed for accounts that do not follow the fiscal calendar. However, the accounts that follow their account-specific fiscal calendar can view the fiscal versions of the dashboards or reports. Wherever the fiscal version of the dashboard or report is not available, the standard version that comes Out of the Box (OOB) is displayed. |